XRP Price Prediction: XRP Ledger's Payments Drop by 70% in 24 Hours, What Comes Next?
XRP is heading into the new week under pressure after a sharp drop in XRP Ledger payment activity added to an already fragile technical setup. The latest concern is not just about price. It is about what falling on-chain usage may be signaling for short-term momentum and whether XRP is at risk of another leg lower.
The headline number is hard to ignore. XRP Ledger payments reportedly fell by around 70% in just 24 hours, while XRP continued trading near the $1.30 area. On its own, one weak day of network activity does not automatically confirm a major bearish trend. However, when a sudden decline in ledger usage appears at the same time as soft price action, traders usually take it seriously.
That is where XRP stands now. The market is dealing with two problems at once. On one side, on-chain activity looks weaker. On the other side, price is still struggling beneath key resistance levels and showing no clear reversal signal. That combination does not support aggressive bullish expectations for next week.
The result is a cautious short-term outlook. XRP is not collapsing, but it is also not showing the kind of strength that would justify a breakout narrative right now.
Why the XRP Ledger Payment Drop Matters
For XRP, network activity matters more than it does for some other tokens because utility has always been part of the asset’s core story. When ledger payments, transfers, and general transactional usage increase, traders often see that as a sign of healthier demand. When those same metrics fall sharply, confidence can weaken just as fast.
A 70% one-day drop in XRP Ledger payments suggests that activity on the network slowed significantly. That can be interpreted in several ways. It may mean reduced user participation, lower transfer demand, or simply a temporary cooldown after a more active stretch. Regardless of the exact cause, markets tend to react to the headline first. A sudden contraction in payment volume usually does not help sentiment.
This matters even more because crypto traders often use on-chain metrics as an early signal. Price may lag for a while, but when network usage starts weakening, some traders see it as a warning that demand is not strong enough to support a sustained recovery.
That does not mean XRP must fall just because payment activity dropped for one day. But it does mean that bullish arguments become harder to defend unless activity stabilizes or rebounds quickly.
XRP Price Is Still Stuck in a Weak Chart Structure
The technical setup is not doing bulls any favors either.
XRP is still trading in a broader downtrend and has struggled to hold onto any short-term upward structure. Recent price action suggests that attempts to build momentum have faded quickly, with sellers stepping in before bulls can reclaim important resistance zones. The pattern of lower highs remains intact, which is one of the clearest signs that bearish pressure has not gone away.
Another issue is the position of the major moving averages. When price trades below key moving averages, those averages often start acting as dynamic resistance. In practical terms, that means every recovery attempt runs into overhead pressure. XRP has been facing exactly that kind of environment.
This is why the chart still looks defensive rather than constructive. The market is not treating XRP like an asset ready to break out. It is treating it like an asset trying to avoid further weakness.
Momentum indicators also do not offer much relief. There is no clear reversal signal, no convincing sign of accumulation, and no obvious bullish divergence strong enough to shift sentiment on its own. That does not mean a bounce is impossible. It simply means that any bounce is likely to face skepticism unless it comes with stronger volume and cleaner price structure.
Key XRP Price Levels to Watch Next Week
The most important zone on the downside is the $1.25 to $1.30 range. This support area has been tested multiple times, which makes it critical for the short-term outlook.
Support levels tend to become more important with repeated tests, but they also become more vulnerable if buyers fail to produce a meaningful rebound. If XRP continues sitting on top of this range without strong follow-through higher, the risk of a breakdown increases. In other words, holding support matters, but how XRP behaves while holding it matters just as much.
On the upside, the first key resistance zone is around $1.38 to $1.40. This area has already limited recent recovery attempts and remains the first major barrier that bulls need to reclaim. As long as XRP stays below that range, it is difficult to argue for a stronger upside move.
Above that, the next larger resistance area sits near $1.60. That level is not the immediate focus for now, but it would come back into view if XRP can first reclaim the $1.38 to $1.40 zone and build momentum above it.
So the short-term trading map looks fairly straightforward:
Key support: $1.25 to $1.30
Immediate resistance: $1.38 to $1.40
Larger resistance: around $1.60
If XRP holds support and pushes back above immediate resistance, sentiment can improve. If support breaks, the bearish case gains much more weight.
XRP Price Prediction for Next Week
The most realistic XRP price prediction for next week is range-bound trading with a bearish bias.
The bullish scenario is still possible, but it needs proof. XRP would need to defend the $1.25 to $1.30 support zone, reclaim $1.38 to $1.40, and show some improvement in XRP Ledger activity. If those things happen together, the market could start shifting from defense to stabilization. That could open the door to a move into the low-$1.40s and possibly higher if follow-through improves.
The neutral scenario may be the most likely base case. XRP spends the week trading between the upper $1.20s and upper $1.30s while the market waits for stronger signals. This would fit the current structure well. Weak momentum, softer on-chain activity, and resistance overhead all point to a market that may consolidate before making its next decisive move.
The bearish scenario becomes more likely if XRP loses the $1.25 area with conviction. A clean break below support would likely shift market attention toward lower demand zones and increase the chance of continued downside. Once a support level fails after repeated testing, sellers often gain confidence quickly.
So for now, the outlook remains cautious. XRP is not showing a confirmed reversal setup. It is showing a market that is still vulnerable unless both price action and on-chain data start improving together.
Can XRP Ledger Activity Rebound Quickly?
Yes, it can.
One important thing to remember is that XRPL metrics can be volatile. Sharp changes in payments and transfer activity do happen, and one weak day does not always turn into a long-term trend. That means traders should avoid overreacting to a single data point in isolation.
Still, markets care about momentum. If ledger activity remains soft for several sessions, it may reinforce the idea that network participation is fading in the short term. If activity rebounds quickly, that would help soften the bearish narrative and could support a more stable price outlook.
In other words, the next few days matter. If XRP Ledger payments bounce back while XRP continues holding support, sentiment could improve faster than many expect. If activity stays weak and price remains pinned below resistance, downside risks are likely to stay elevated.
What Investors Should Expect Next Week
Expectations for next week should stay measured.
Right now, XRP is dealing with a combination that usually keeps buyers cautious: declining on-chain activity and a weak chart structure. That does not guarantee a major drop, but it does reduce the odds of a clean bullish breakout in the immediate term.
For bulls, the goal is simple. Hold the $1.25 to $1.30 zone, improve network activity, and reclaim the $1.38 to $1.40 resistance band. If that happens, the tone of the market could shift from cautious to constructive.
For bears, the argument is also clear. As long as XRP remains below resistance and payment activity stays soft, the path of least resistance remains sideways to lower.
That makes next week less about big upside targets and more about whether XRP can stabilize. The market does not need perfection right now. It needs evidence that the weakness is fading. Until that evidence appears, the short-term XRP outlook remains soft.
Final Verdict
The 70% drop in XRP Ledger payments is a real warning sign, especially because it happened while XRP price was already trading in a fragile structure near support.
That does not mean a collapse is inevitable. It does mean bullish expectations should stay modest for now.
The key issue is the combination of weaker network activity and a chart that still favors sellers. That mix often leads to continued consolidation or another push lower unless conditions improve quickly. For XRP to shift back into recovery mode, it needs both stronger on-chain participation and a clean move above nearby resistance.
For next week, the most balanced view is this: XRP may keep trading near current levels, but the short-term risk still leans to the downside unless support holds firmly and ledger activity rebounds.
FAQ
Why does a drop in XRP Ledger payments matter for XRP price?
A sharp fall in XRP Ledger payments can signal weaker network participation, lower transaction demand, or reduced activity across the ecosystem. Traders often treat that as a negative short-term signal for XRP price.
What is the most important XRP support level right now?
The most important near-term support zone is between $1.25 and $1.30. If XRP holds above this area, the market can still stabilize. If it breaks, downside pressure may increase.
What resistance levels should XRP traders watch next week?
The first major resistance zone is around $1.38 to $1.40. Above that, the next larger resistance area is near $1.60.
Is XRP bullish or bearish right now?
The short-term setup looks bearish to neutral. XRP is still trading below key resistance levels, momentum remains weak, and the broader chart structure still favors sellers.
Can XRP recover if XRP Ledger activity improves?
Yes. If on-chain activity rebounds and XRP continues holding support, sentiment could improve quickly. However, price would still need to break above nearby resistance to confirm a stronger recovery.
What is the XRP price prediction for next week?
The most likely short-term outlook is range-bound trading with a bearish bias. XRP could continue consolidating if support holds, but a break below support would raise the risk of further downside.
Glossary
XRP: XRP is the native digital asset used within the Ripple ecosystem and on the XRP Ledger for transfers, liquidity, and payment-related functions.
XRP Ledger (XRPL): XRP Ledger is the blockchain network that supports XRP transactions, payments, and other on-chain activity.
On-Chain Activity: On-chain activity refers to measurable actions recorded directly on a blockchain, such as payments, transactions, and wallet activity.
Support: Support is a price level where buying interest tends to appear and help prevent further declines.
Resistance: Resistance is a price level where selling pressure tends to increase and limit upside movement.
Moving Average: A moving average is a technical indicator that smooths price data over a set period and is often used to identify trend direction and dynamic support or resistance levels.
Lower Highs: Lower highs happen when each recovery attempt peaks below the previous one, often signaling a continuing downtrend.
Consolidation: Consolidation is a period when price trades within a relatively narrow range instead of trending strongly up or down.
Accumulation: Accumulation refers to a market phase where buyers gradually build positions, often before a stronger upward move.
Momentum Indicator: A momentum indicator is a technical analysis tool used to measure the speed and strength of a price move.
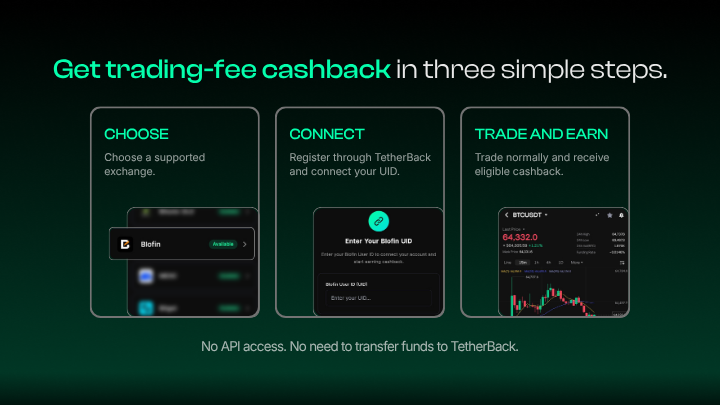
About TetherBack
TetherBack is a crypto cashback and rewards platform built for active traders who want to reduce effective trading costs. By partnering with supported exchanges, TetherBack shares a portion of trading fee revenue back to users in the form of cashback.
The platform does not hold user funds and does not operate as an exchange. Traders continue to execute trades directly on their chosen exchange while earning rewards through the partnership structure.
TetherBack focuses on cost efficiency, transparency, and providing traders with a structured way to maximize value from their existing trading activity.